
Bài viết này sẽ giới thiệu tổng hợp từ vựng hữu ích cho bài thi IELTS Writing Task 1. Để đạt điểm trọn vẹn phần Task 1, yêu cầu bạn cần tìm hiểu kỹ về từng dạng chủ đề của bài thi, nghiên cứu tìm cách làm bài, các dạng cú pháp sử dụng và cần nhất là từ vựng.
Kiểm tra phát âm với bài tập sau:

Tổng quan về phần thi IELTS Writing Task 1
Khái niệm chung
IELTS Writing Task 1 là một phần trong bài thi IELTS Academic và General Training. Trong bài thi IELTS Academic, bạn sẽ được yêu cầu viết một bài văn ngắn (150 từ) để mô tả và phân tích một hoặc hai biểu đồ tròn, biểu đồ cột, biểu đồ đường, bản đồ hay bảng số liệu. Phần này chiếm ⅓ tổng điểm phần thi Writing và bạn cần hoàn thành trong khoảng thời gian 20 phút.
Mục đích của bài thi này là để đánh giá khả năng viết đoạn văn và sử dụng từ vựng, ngữ pháp của bạn, cùng với khả năng phân tích và diễn giải các số liệu trong biểu đồ hay bản đồ.
- Bố cục của bài Writing Task 1
Mở bài: Introduction
Phần Introduction của IELTS Writing Task 1 yêu cầu bạn giới thiệu loại biểu đồ, sơ đồ hoặc bản đồ được đưa ra trong đề bài và tóm tắt các thông tin chính một cách ngắn gọn. Mục đích của phần này là để giới thiệu cho người đọc biết được về nội dung của bài viết và tạo sự liên kết giữa đề bài và nội dung của bài viết. Phần Introduction thường gồm 2-3 câu.
Tóm tắt: Overview
Phần Overview của Writing Task 1 là phần tóm tắt ngắn gọn về các thông tin chính và xu hướng chung của biểu đồ, bảng số liệu hay đồ thị mà bạn đã nhìn thấy. Overview giúp định hướng cho bài viết của bạn và cho người đọc biết được những gì sẽ được nêu ra trong phần thân bài.
Thân bài: Body Paragraphs
Đây là phần chính của bài thi Task 1. Sau khi hoàn thành phần tóm tắt, bạn cần đưa ra các chi tiết cụ thể về các số liệu trong đề bài. Hãy chú ý đến các biến số trong dữ liệu, mô tả chúng một cách chi tiết để bài làm đạt trọn vẹn điểm cao.
Tiêu chí chấm điểm
Bài thi IELTS Writing Task 1 được chấm dựa trên các tiêu chí sau đây:
- Task Achievement (Khả năng hoàn thiện yêu cầu bài thi và phân tích đề bài tốt).
- Coherence and Cohesion (Thể hiện sự mạch lạc, gắn kết các câu trong đoạn văn).
- Lexical Resource (Vốn từ sáng tạo).
- Grammatical Range and Accuracy (Độ chính xác và đa dạng của ngữ pháp).
Để đạt được điểm tối đa tiêu chí chấm điểm, bạn cần nắm một số mẹo sau:
- Sắp xếp các thông tin một cách logic: trước khi bắt đầu viết, hãy đọc kỹ thông tin được cung cấp trong đề bài. Sau đó, sắp xếp các thông tin một cách logic. Bạn cần tập trung vào các thông tin quan trọng và sử dụng các con số, dữ liệu làm minh họa cho bài viết thêm sinh động.
- Sử dụng các từ nối: để tạo cho bài viết mạch lạc và có sự liên kết với nhau, khuyên bạn nên sử dụng các từ nối như “furthermore”, “in addition”, “moreover”, “however”, “on the other hand” và “nevertheless”… Những từ này giúp liên kết các câu với nhau và tạo ra một lối viết bài rõ ràng, cuốn hút.
- Bạn cần sử dụng các câu có cấu trúc phức tạp để làm bài viết của bạn trở chuyên nghiệp hơn, có chiều sâu.
>>Đọc thêm:
- IELTS Speaking Part 1 – Tổng hợp mẫu câu trả lời theo cấu trúc đề thi mới nhất
- Các bài mẫu IELTS Speaking Part 2 theo chủ đề thường gặp nhất
Một vài điều “không” bạn cần lưu ý
- Không mô tả mọi số liệu có trong bảng số liệu hay biểu đồ của đề bài. Kỹ năng quan trọng khi làm Task 1 chính là biết chọn lọc thông tin một cách chính xác và hợp lý nhất. Bạn chỉ nên đề cập đến những số liệu thật sự cần thiết trong đề.
- Không viết lan man, dài dòng vì Task 1 chỉ có 20 phút làm bài. Vì phần Task 2 cần nhiều thời gian hơn và điểm số cũng chiếm nhiều hơn.
- Không đề cập ý kiến hay quan điểm cá nhân ở trong Task 1 vì mục đích chính của Task 1 là diễn đạt, phân tích số liệu của bảng số liệu hay biểu đồ.
- Không sử dụng những đại từ thể hiện tính cá nhân như I, me, we trong bài.
- Không viết tắt, đặc biệt là những từ mang nghĩa phủ định như don’t, doesn’t.
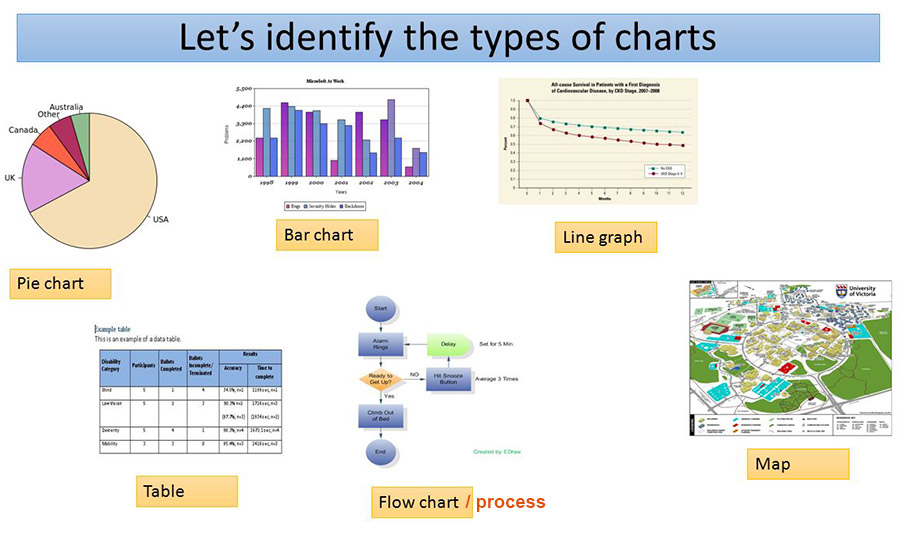
Các chủ đề trong Task 1 thường gặp
Sẽ có 7 chủ đề chính trong Task 1 IELTS Writing:
- Biểu đồ đường (Line chart)
- Biểu đồ cột (Bar chart)
- Biểu đồ tròn (Pie chart)
- Bảng số liệu (Table)
- Quy trình (Process)
- Bản đồ (Maps)
- Biểu đồ kết hợp (Mixed chart)
Nguồn: IDV IELTS
Các từ vựng theo chủ đề của phần thi Writing Task 1
Lời khuyên để bạn đạt được điểm phần Writing IELTS cao là bạn hãy học từ vựng theo chủ đề IELTS. Với các chủ đề của riêng phần thi Task 1, bạn có thể phân từ vựng theo chủ đề IELT như sau.
Nhóm từ vựng miêu tả về biểu đồ
Từ vựng miêu tả xu hướng thay đổi
| Danh từ | Động từ | |
| Xu hướng tăng | A rise | Rise |
| An increase | Increase | |
| An upward trend | Go up | |
| A jump | Rocket | |
| A leap | Upsurge | |
| An improvement | Uplift | |
| Xu hướng giảm | A drop | Drop |
| A fall | Fall | |
| A decrease | Decrease | |
| A decline | Decline | |
| Xu hướng ổn định | A steadiness | Remain steady |
| A plateau | Plateau | |
| A stability | Remain stable | |
| A static | Remain static | |
| Xu hướng giao động | A fluctuation | Fluctuate |
| Variation | Vary | |
| Đạt mức cao nhất | A peak | Peak at |
| Highest point | To reach a peak of | |
| Đạt mức thấp nhất | Lowest point | Hit a low point |
| Hit a trough |
Miêu tả tốc độ thay đổi
| Tốc độ thay đổi | Tính từ | Trạng từ |
| Nhanh | Dramatic | Dramatically |
| Tremendous | Tremendously | |
| Rapid | Rapidly | |
| Sharp | Sharply | |
| Trung bình | Marked | Markedly |
| Moderate | Moderately | |
| Chậm | Steady | Steadily |
| Gradual | Gradually | |
| Slight | Slightly | |
| Slow | Slowly | |
| Constant | Constantly |
Nhóm từ vựng miêu tả về bản đồ
Miêu tả sự xuất hiện
- Build
- Construct
- Erect
- Emerge
- Spring up
Miêu tả sự biến mất
- Destroy
- Deconstruct
- Vanish
- Demolish
- Knock down
- Devastate
- Cut down
Miêu tả phương hướng
| Danh từ | Tính từ |
| North | Northern |
| South | Southern |
| East | Eastern |
| Northeast | Northeastern |
| Southeast | Northwestern |
| Northwest | Southeastern |
| Southwest | Southwestern |
Nhóm từ vựng miêu tả về quy trình
Miêu tả các bước quy trình:
- Firstly
- Secondly
- Thirdly
- Following that
- Subsequently
- Finally
- After this step/process
- Once this step is completed
- The steps involved
Miêu tả chu kỳ hoặc sự lặp lại
- Continues indefinitely
- The cycle then repeats itself
Bên cạnh các từ vựng trên, bạn có thể tham khảo thêm một cụm từ và từ nối sau để làm bài viết thu hút hơn, giúp bạn đạt điểm cao phần Writing.
- Một số từ nối: likewise, also, while, according to statistics/survey data/estimation, it is noticeable that, in contrast, however, whereas, on the other hand, in addition,….
- Cụm từ liệt kê: Firstly/ First of all, Secondly, After that, From this, Next, After this, Following this, At the first stage, In general, In common, It is obvious, As can be seen, At the first glance, At the onset,….
- Cụm từ nên sử dụng trong phần mở bài: The … gives information about…, the … shows data about…, the diagram shows the comparison of, the table figure represents the differences, the graph enumerates the number of, the pie chart provides the amount of,…
- Cụm từ cho phần kết bài: In conclusion, to sum up, considering everything, in a nutshell, overall, in short, in a word, to summarise, to repeat,…
Một số bài Writing Task 1 cho bạn tham khảo
Dạng biểu đồ cột ( Bar chart):
Đề bài: The graph below shows the hours of teaching per year done by each teacher in four different categories. Summarize the information by selecting and reporting the main features of the graph and make comparisons where relevant.
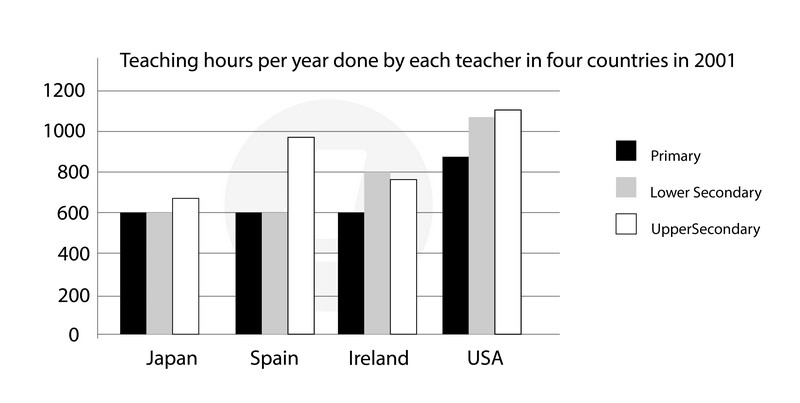
Bài mẫu: The graph compares the amount of teaching done by primary, lower secondary, and upper secondary school teachers in four different countries in 2001.
Overall, teachers in the USA taught significantly more than teachers in the remaining three countries. Furthermore, upper secondary school teachers generally worked more hours than other teachers.
In 2001, upper secondary school teachers in the USA taught around 1100 hours per year. This was closely followed by lower secondary school teachers, who did only slightly fewer than 1100 hours, compared to U.S primary school teachers, who taught less than 900 hours per year. In Ireland, both upper and lower secondary school teachers taught approximately 800 hours per year, while their primary school counterparts did around 600.
Meanwhile, both primary and lower secondary school teachers in Japan and Spain taught for approximately 600 hours per year in 2001. Similarly, upper secondary school teachers in Japan also only taught for around 600 hours, while their Spanish counterparts spent around 1000 hours teaching per year.
Dạng biểu đồ đường (Line graph):
Đề bài: The graph below shows the number of overseas visitors to three different areas in a European country between 1987 and 2007. Summarise the information by selecting and reporting the main features and make comparisons where relevant.
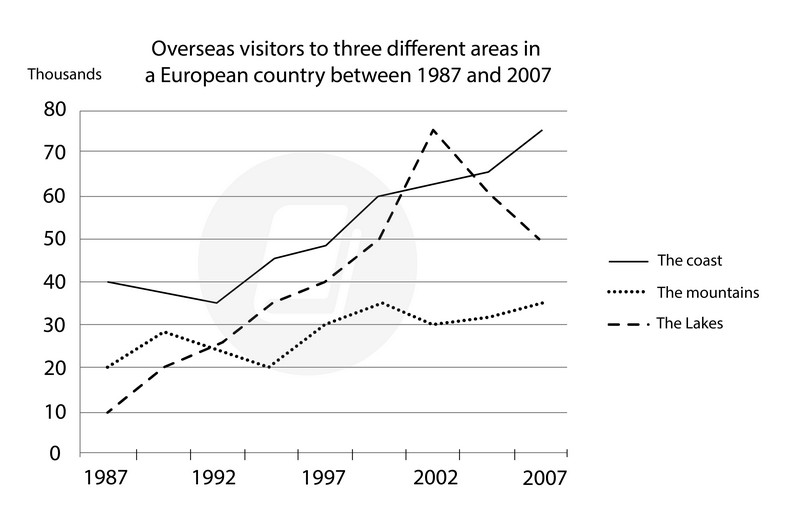
Bài mẫu: The graph compares the number of foreign travellers that visited three different types of areas in a particular European country over twenty years from 1987 to 2007.
Overall, coastal areas attracted the largest amount of foreign tourists in most years of the survey, while mountainous areas appeared to be the least popular for the most part. In addition, the number of tourists travelling to all three areas increased over the period.
In 1987, around 40,000 foreign travellers visited the coast of this European country. This figure dropped slightly to around 35,000 visitors in 1992, after which it began to rise, reaching approximately 75,000 visitors in 2007. Meanwhile, the number of foreign travellers visiting the mountains fluctuated between 20,000 and 30,000 during the first half of the period, before rising further to around 35,000 tourists in 2007.
The number of foreign tourists visiting the lakes of this country continually rose over the first fifteen years of the period, peaking at 75,000 visitors in 2002. However, this figure began to drop significantly in the remaining years, reaching 50,000 visitors in 2007.
Dạng biểu đồ tròn (Pie chart):
Đề bài: The chart below shows the percentage of the day working adults spent doing different activities in a particular country in 1958 and in 2008. Summarise the information by selecting and reporting the main features and make comparisons where relevant.
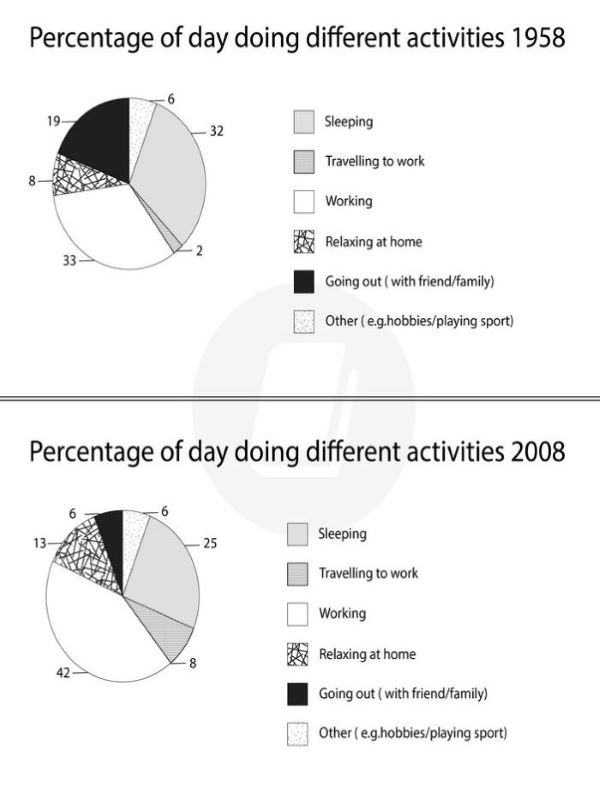
Bài mẫu: The pie charts illustrate the average percentage of an employed person’s day spent doing different activities in 1958 and 2008, in a particular country.
Overall, employed people in this particular country spent the most amount of time in a day, in both 1958 and 2008, at work. Furthermore, there was an inverse relationship between working and sleeping over the 50 years.
In 1958, working people in this country spent one-third of their day at work, followed by just under one-third of their day sleeping. Going out with friends or family took up the next largest portion of time in a day, at 19%. Meanwhile, travelling to work was the activity that took up the least percentage of time in someone’s day.
Fifty years later, the percentage of a day that people spent at work increased to 42%, while the figure for sleeping had dropped to 25%. Less time was spent going out with family and friends (6%), but more time was allocated to relaxing at home (13%). In addition, the figure for the portion of the day that people spent travelling to work quadrupled to 8% over the period.
Dạng bảng số liệu (Table):
Đề bài: The table below shows the percentage of first-year students who gave a ‘very good’ rating to the resources provided by the college, for three courses. Summarise the information by selecting and reporting the main features, and make comparisons where relevant.
| Pre-course information | Teaching | Tutor | Resources (print) | Other resources | |
| Economics | 59% | 95% | 90% | 81% | 60% |
| Law | 72% | 62% | 76% | 70% | 80% |
| Commerce | 95% | 95% | 93% | 85% | 81% |
Bài mẫu: The table gives information about the percentage of first-year students who rated different aspects of their course as being ‘very good’.
Overall, students studying Commerce appeared to be the most pleased with the resources provided by the college for their course.
An average of 94% of first-year students studying Commerce found that their pre-course information, teaching, and tutoring were very good, while just over 80% found the printed resources and other resources to also be very good. Meanwhile, around 70% of Law students found their printed resources, tutor, and pre-course information to be of a very good standard. Around 60% rated the teaching as being very good, while 80% rated the other resources as very good.
However, only 60% of Economics students found their pre-course information and other resources to be very good. The teaching and tutor were rated very good by at least 90% of students, compared to just over 80% who voted the printed resources as being very good.
Dạng quy trình ( Process):
Đề bài: The diagrams below give information about the manufacture of frozen fish pies.
Summarize the information by selecting and reporting the main features and make comparisons where relevant.
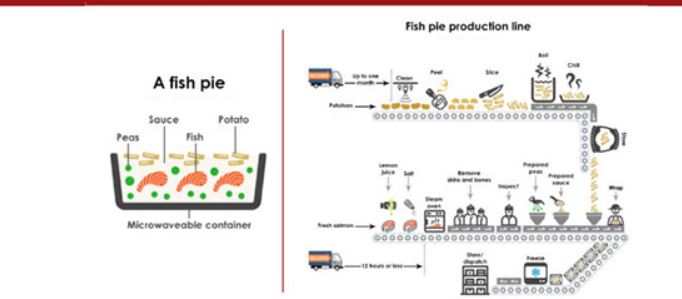
Bài mẫu: The pictures illustrate the ingredients that go into a factory-made fish pie, and the various steps in its production.
The pie contains salmon, peas, sauce and potatoes, and there are ten stages in its manufacture, from delivery to dispatch. One of the ingredients, the potato, goes through its six-stage preparation process before it can be added to the pie.
Potatoes are the first ingredient to be prepared on the production line. They are delivered to the factory up to a month before the process begins, and they must be cleaned, peeled and sliced. Potato peelings are thrown away, and the sliced potatoes are boiled, then chilled and stored.
When fresh salmon arrives at the factory, lemon juice and salt are added, and the fish is cooked in a steam oven within 12 hours of delivery. Next, factory workers remove and dispose of the skin and bones, and the fish is inspected. Following inspection, pre-prepared peas, sauce and potatoes are added. The resulting fish pies are wrapped, frozen and then stored or dispatched.
- Dạng bản đồ (Map):
Đề bài: The maps below show the layouts of the nature Museum between 2010 and 2013.
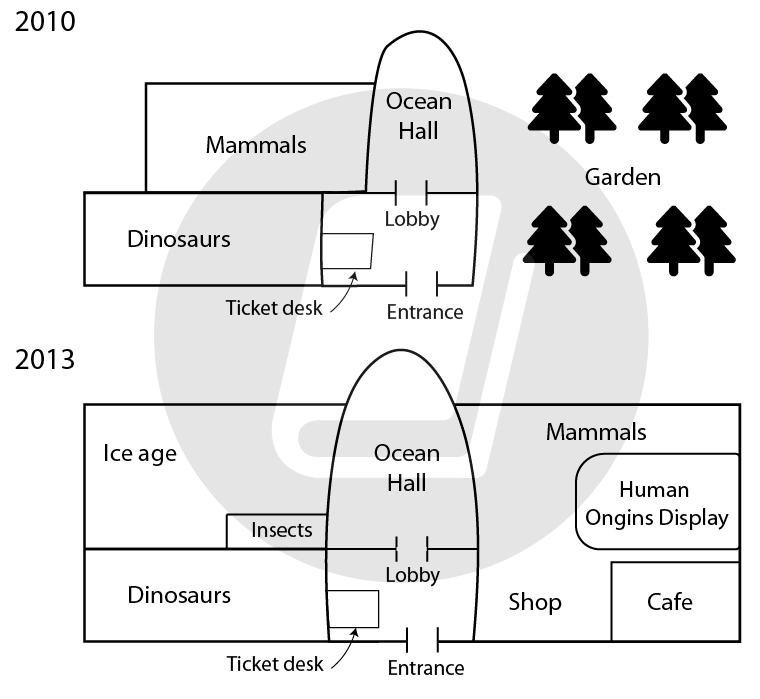
Bài mẫu: The maps illustrate the changes to a natural museum between 2010 and 2013.
Overall, the museum underwent several changes, with the most noticeable being a major extension to the building, along with several new displays and facilities.
In 2010, the museum housed three main exhibition rooms and a lobby which contained the ticket desk. The dinosaur display was located in the room directly to the left of the lobby area, while the ocean hall was found directly behind the lobby. Meanwhile, the mammal exhibition was located in the room behind the dinosaur display.
By 2013, an extension had been built on the right side of the building, which was previously a garden. The new section of the building contained a new shop and cafe, along with a new display about human origins, and a new mammal display room. The room which previously housed the mammal display was fitted out with a new display on the Ice Age, along with a new room containing an insect display.
Trên đây chỉ là một số kiến thức và vài bài mẫu Writing Task 1 gửi đến bạn để tham khảo, học hỏi thêm kiến thức luyện tập cho phần thi Writing Task 1 của bạn. Chúc bạn thành công, đạt được điểm số như mong muốn.

Mừng sinh nhật ELSA tròn 10 tuổi: Đặc quyền UPGRADE Premium trọn đời chỉ 2.999K
10 năm khởi tạo là cột mốc vàng để ELSA và bạn cùng nhìn lại hành trình đã qua và tiếp tục đầu tư cho những giá trị bền vững. Nhân dịp kỷ niệm sinh nhật thập kỷ rực rỡ, ELSA Speak mang đến đặc quyền nâng cấp lớn nhất từ trước đến nay, dành […]

Hướng dẫn nâng cấp tài khoản từ ELSA Pro lên ELSA Premium
ELSA Premium cho phép sử dụng toàn bộ các tính năng mới nhất của ELSA. Bài viết sẽ hướng dẫn bạn nâng cấp từ ELSA Pro lên ELSA Premium nhé!

Hướng dẫn mua gói ELSA Premium 3 tháng
Với các tính năng bổ ích, gói học ELSA Premium đã thu hút không ít sự chú ý kể từ khi ra mắt. Làm thế nào để mua ELSA Premium 3 tháng?
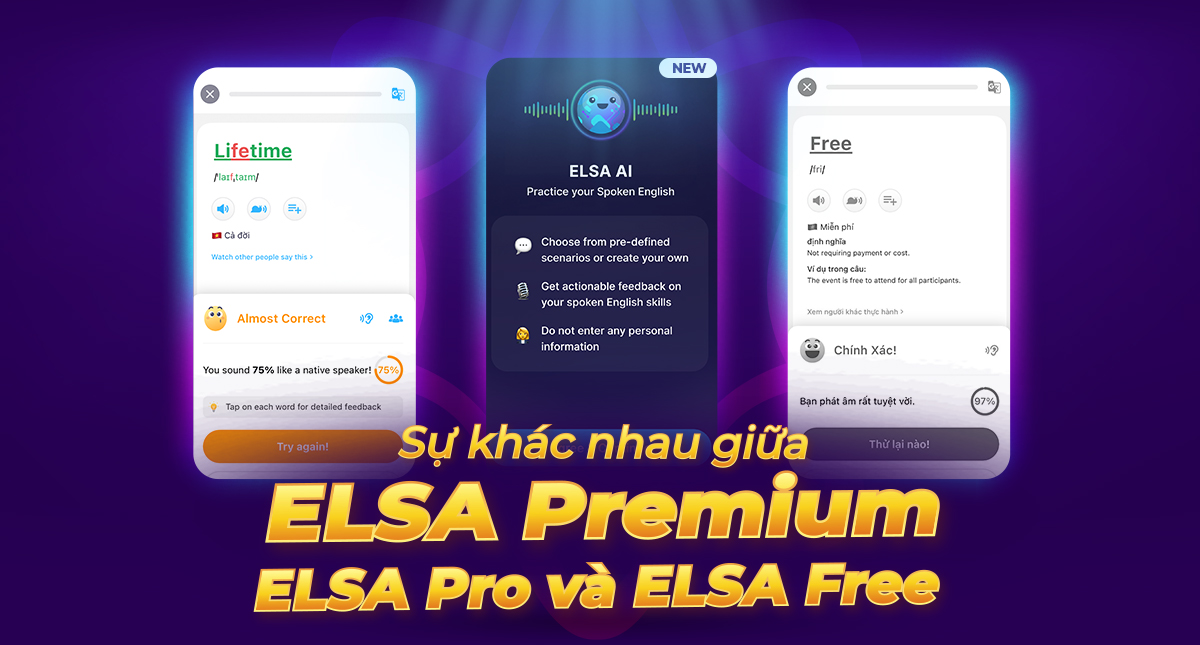
Sự khác biệt giữa ELSA Premium, ELSA Pro và ELSA Free
Vừa qua, ELSA đã cho ra mắt gói học ELSA Premium được đông đảo học viên quan tâm và đón nhận. Vậy thì gói ELSA Premium có gì khác so với ELSA Pro và ELSA Free? Hãy cùng tìm hiểu qua bài viết này nhé!

Khóa học tiếng Anh dành riêng cho người đi làm: ELSA Premium
Vừa qua, ELSA đã ra mắt gói học ELSA Premium hướng tới đối tượng dân công sở. Vậy thì gói học này bao gồm những gì? Vì sao ELSA Premium lại phù hợp với người đi làm? Hãy cùng tìm hiểu qua bài viết sau nhé!

ELSA AI – Đối thoại tiếng Anh trực tiếp với AI
ELSA đã ra mắt tính năng học tập mới cho phép người học luyện nói trực tiếp cùng AI. Hãy cùng tìm hiểu chi tiết về tính năng qua bài viết

ELSA Premium – Gói học tiếng Anh tiên tiến nhất của ELSA
ELSA vừa ra mắt gói học ELSA Premium. Với lời giới thiệu “gói học tiếng Anh tiên tiến nhất từ trước đến nay”, gói học này bao gồm những gì?

Sinh nhật ELSA – Mở deal lớn, nhận quà ngay!
Trải qua 10 năm phát triển, từ một startup EdTech mang sứ mệnh giúp người học tự tin nói tiếng Anh, ELSA Speak nay đã trở thành nền tảng luyện phát âm và giao tiếp ứng dụng AI được hàng triệu người dùng tại nhiều quốc gia tin tưởng lựa chọn. Cột mốc 10 năm […]
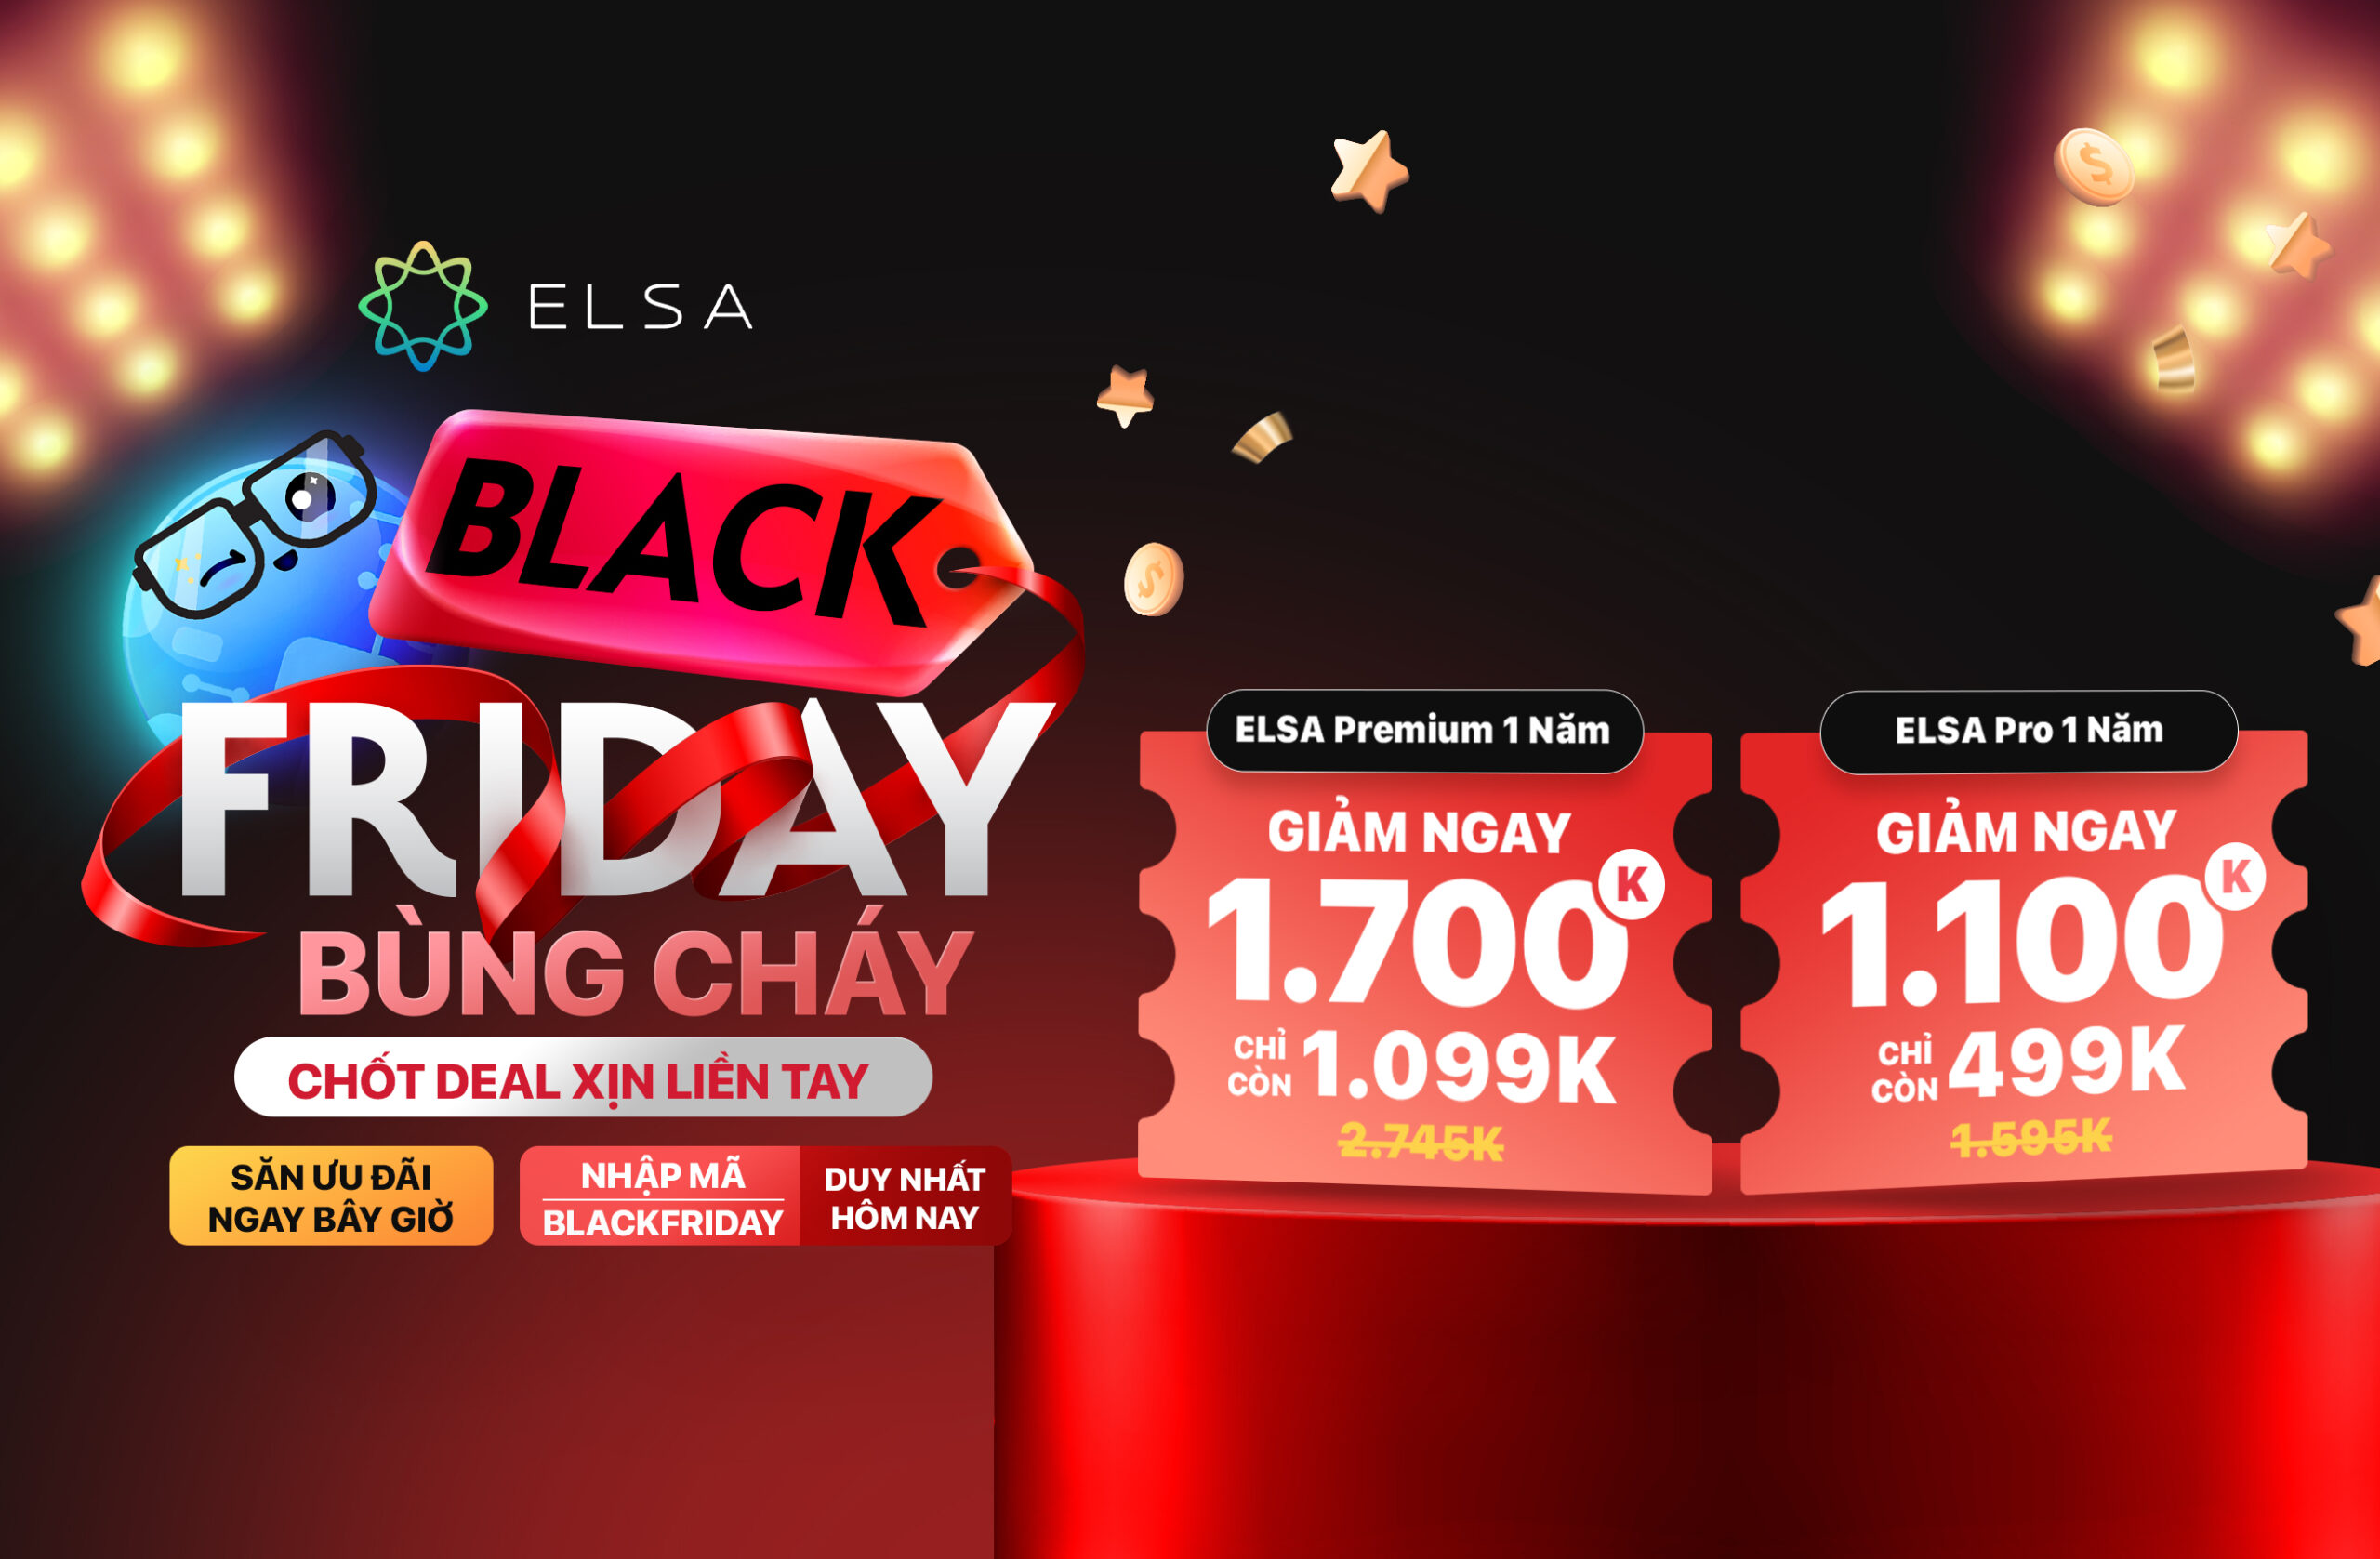
ELSA Speak Black Friday 2025 – 300 suất cuối cùng
Black Friday 2025 tại ELSA Speak đã chính thức khởi động với loạt ưu đãi hấp dẫn. Chỉ còn 300 suất – Deal giảm đến 5 Triệu sắp cháy hàng! Đây là dịp đặc biệt trong năm để sở hữu các gói ELSA Premium và ELSA Pro với giá ưu đãi hiếm có. Trải nghiệm […]
Nhận ưu đãi cực khủng tại ELSA cùng Khoai Lang Thang [12.11 – 13.11]
Khoai, một chàng trai trẻ tràn đầy đam mê với khát vọng chinh phục thế giới, đang từng bước biến giấc mơ của mình thành hiện thực. Tuy nhiên, thử thách lớn nhất mà anh phải đối mặt trên hành trình này là tiếng Anh. Với ý chí kiên định, Khoai đã bắt đầu hành […]
TOP 10 chứng chỉ tiếng Anh quốc tế thông dụng, dễ xin việc
Theo xu hướng hội nhập hóa hiện nay, chứng chỉ tiếng Anh đã trở thành một chìa khóa để có thể học tập và làm việc trong môi trường quốc tế. Vậy có những chứng chỉ thông dụng nào được Việt Nam và các nước lớn trên thế giới công nhận? Cùng ELSA Premium tìm […]

10+ cách giới thiệu công việc bằng tiếng Anh chuyên nghiệp nhất
Muốn giới thiệu về công việc bằng tiếng Anh thì trước hết bạn cần nắm vững bộ từ vựng và mẫu câu thường dùng xoay quanh công việc của mình. Bài viết dưới đây sẽ cung cấp cho bạn những từ vựng, mẫu câu xoay quanh chủ đề công việc để bạn có thể nói […]
TOEIC là gì? Tổng hợp thông tin về kỳ thi TOEIC mới nhất 2024
Bạn đang tìm hiểu TOEIC là gì? Thi TOEIC sẽ có được những lợi ích nào hay cấu trúc của bài thi này ra sao? Mời các độc giả theo chân ELSA Premium để tìm hiểu tất tần tật về chứng chỉ TOEIC 2024 nhé! TOEIC là gì? Trên các diễn đàn học tiếng Anh […]

Top 20 app dịch tiếng Anh đáng tin cậy và tốt nhất 2024
App dịch tiếng Anh từ lâu đã là trợ thủ đắc lực của nhiều người, có thể dùng với đa dạng mục đích như làm việc, du lịch, học tập,… Cùng tìm hiểu 20 app dịch tiếng Anh tiện lợi và phổ biến nhất tại đây nhé. Ưu nhược điểm của việc sử dụng app […]

Bộ 50 từ vựng phỏng vấn tiếng Anh hữu ích, thông dụng nhất 2024
Tầm quan trọng khi sử dụng tiếng Anh trong phỏng vấn xin việc Tiếng Anh hiện là ngôn ngữ được sử dụng rộng rãi trong cả giao tiếp đời sống cũng như trong công việc. Rất nhiều các doanh nghiệp đã liệt kê tiếng Anh như một yêu cầu quan trọng trong bản mô tả […]